Undisclosed · Goodyear, Arizona
Stream Phoenix
77MW
The power of 63,000 US homes.
Drawing power since May 2026. Projected to reach 267 MW by Jan 2030.
- H100-equivalents
- 46K
- Capital cost
- $2.4B
- Chips
- H100
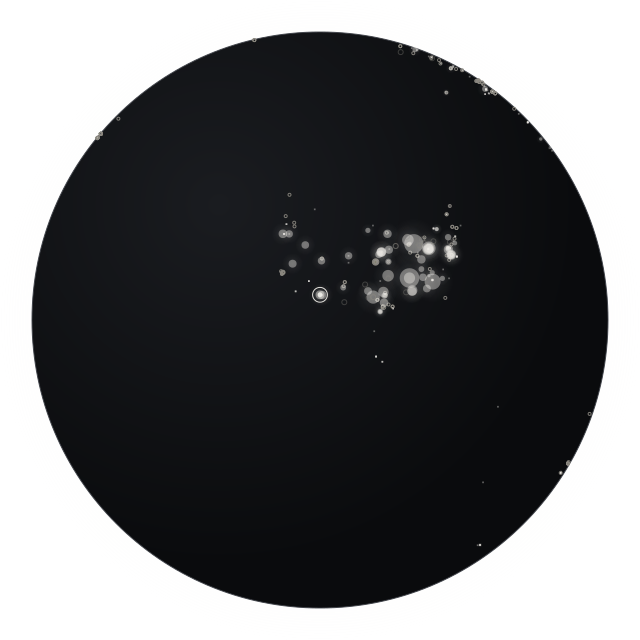
Power over time
facility power · 4 milestonesEvery milestone
- 30 Oct 2022 — Construction beginning, as can be seen on satellite. Major renovations on western side of the non AI building (PX1), including adding generators and cooling towers.
- 31 Jan 2026 — Major construction has finished on AI building 1, and AI building 6 has been expedited, as depicted by satellite imagery.
- 1 May 2026 77 MW Estimated: AI building 1 should be operational. Major construction work finished by January 31, 2026, and the shell looked complete by that date. We estimate after three months the building will be operational.
- 1 Jan 2030 · projected 267 MW Although official promotional sources estimate the campus to be fully operational in 10-12 years, it is likely to be finished sooner than this given the empirical durations for other data center campuses as well as because AI building 6 has been expedited. The first AI building took approximately 24 months to complete. Assuming construction for a new building starts midway for every building, then the campus will be complete in 4 years for the 5 remaining buildings, since AI buildings 2 and 6 are both underway.
Every step Epoch planned here on 2 Sep 2026 is still on plan. Planned against reached
Nuclear and gas lead the three grids that serve Maricopa County
net generation by fuel · Oct 2025 to Sep 2026Salt River Project SRP · balancing authority
- Gas 33%
- Coal 8%
- Nuclear 51%
- Wind 1%
- Solar 7%
- Hydro <1%
- Other 0%
Arizona Public Service Company AZPS · balancing authority
- Gas 39%
- Coal 26%
- Nuclear 0%
- Wind 10%
- Solar 24%
- Hydro 0%
- Other 1%
Western Area Power Administration - Desert Southwest Region WALC · balancing authority
- Gas 48%
- Coal 0%
- Nuclear 0%
- Wind 9%
- Solar 6%
- Hydro 37%
- Other 0%
The utilities that serve Maricopa County, AZ, report to 3 grids; the data does not show which one feeds the site. Each grid is a balancing authority. Generation only; imports are excluded. Every grid behind an AI site.
Owners plan 3.6 GW of new power in Maricopa County, mostly storage
power plants in Maricopa County · EIA-860M, September 2026- Saddleback Generation Station
- Desert Sand BESS
- Maricopa Solar
- Red Hawk
- Romero Energy Center
In service in Maricopa County today: 24.0 GW. Since January 2023: 6.4 GW added, 0 MW retired. Owners plan to retire 3 MW more. 4 more planned plants are listed on the county’s row. A plant in the same county does not mean it feeds the site. Power plants near every AI site.
Sources
selected by Epoch AIData: Epoch AI, “AI data centers”, CC BY 4.0, retrieved 22 Oct 2026. Facility power adds cooling and other overhead to the IT power the servers draw. Placed at the centre of Goodyear. Grid: U.S. Energy Information Administration, Hourly Electric Grid Monitor (Form EIA-930), public domain, retrieved 16 Oct 2026; utilities by county from Form EIA-861 and the U.S. Census Bureau Geocoder, public domain. Power plants: U.S. Energy Information Administration, Form EIA-860M, public domain, inventory as of September 2026. All sources.